This is totally awesome…
Code named Gemini, PowerPivot is an addin for Excel 2010 which gives you BI out of the box.
There's still the need for a decent data warehouse, so Database guys like me will still be required.
Given the nature of most data out there, this is both great and dangerous at the same time.
What's really compelling is the ability to suck in data from the web to compare your current data with.
There's also the PowerPivot server option in SharePoint 2010.
Note: You need to install SharePoint 2010 and not configure it and then install Sql2008R2 to let the magic begin.
Most people will only install the 32 bit version of Excel 2010 - the 64 bit is for those business analysts using PowerPivot to the extreme
..as long as they have more than 4G of RAM on their desktop.
Regards,
Tom BizannesExcel 2010 Addins
Thursday, July 29, 2010
Monday, September 14, 2009
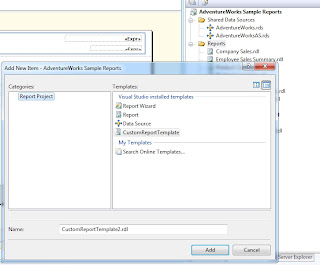
Reporting Services 2008 custom template
You can create a custom template by editing a report and placing it in one of the following locations depending if you have a 64 bit or 32 bit pc.
C:\Program Files (x86)\Microsoft Visual Studio 9.0\Common7\IDE\PrivateAssemblies\ProjectItems\ReportProject
C:\Program Files\Microsoft Visual Studio 9.0\Common7\IDE\PrivateAssemblies\ProjectItems\ReportProject
Then to use this template you right click on the reports menu and select new item.
What one would do is to have a nicely formatted header and footer with page numbers etc.
The only problem is that the wizard is nice in setting up your table or matrix.
It just doesn't allow one to have a default page of A4. Instead it defaults to the us letter sizes.
C:\Program Files (x86)\Microsoft Visual Studio 9.0\Common7\IDE\PrivateAssemblies\ProjectItems\ReportProject
C:\Program Files\Microsoft Visual Studio 9.0\Common7\IDE\PrivateAssemblies\ProjectItems\ReportProject
Then to use this template you right click on the reports menu and select new item.

What one would do is to have a nicely formatted header and footer with page numbers etc.
The only problem is that the wizard is nice in setting up your table or matrix.
It just doesn't allow one to have a default page of A4. Instead it defaults to the us letter sizes.
Tuesday, September 09, 2008
Sydney Sql Server User Group 9th September 2008
Quite an interesting night based around Sql Server Reporting Services 2008…..
The pizza was plentiful…Cholesterol levels rose quite a bit last night.
Grant from Angry Koala, gave away some of his little koala bears for answers to some of his questions!
Interesting Marketing ploy!
Maybe MacroView needs to give away a lot more cubes!
The exciting news is that in October a SQL Server 2008 feature Pack will come out with lots more goodies such as report builder with a nice office 2007 look and being almost the same as the report designer!
Business users should get exciting.
There will be some other exciting new extras in this so will let you guys know…..
Hopefully will go through all this in the sql code camp in October etc…
There should be a lot more feature packs so that nice enhancements can be delivered faster and easier….
The new report designer is much nicer and changed quite a bit.
The tablix controls means smarter simpler and more powerful reporting without code gymnastics!
Big reports run smarter – eg. Only render the first page so they won’t bring the server to it’s knees!
Also the outputs to Excel are better along with the new output to Word. Nice!!!
Apparently one of the uses is to generate and send monthly invoicing etc….
The rich text stuff was only briefly flashed on the screen, but everything is so much nicer that you won’t want to do anything with the “old” stuff…
Two tips of the day:
1: Setting the interactive size for height and width to zero means it will fit the whole screen – e.g. no next page stuff.
The page size settings apply to printing…..
2: Name all reports starting with a number e.g. R001 – New Prospects.
That way every time a client ( or internal user ) calls about a report, it is really easy to figure out which one.
And what with the long names you use, many users will also get to know their favourite reports by number as well!
Coming up:
Next Wednesday at Microsoft, Adam Cogan at the .net user group will go over all the admin stuff..
I might go along and keep him in line and teach him a few tricks to do with incorporating this into SharePoint!
Also SQL Code Camp in Wagga Wagga is coming up this October so it should be quite interesting…
Regards,
Tom Bizannes
Microsoft Certified Professional
Databases and Office Development
Sydney, Australia
Thursday, May 15, 2008
Integrating Reporting Services with SharePoint
Had fun trying this on a windows 2008 box.
Everything worked after hitting each bit a few times!
So important to get permissions set, root site collections set properly and IIS7 configured right before installing anything.
So the steps in order are:
Set up IIS7 with all the correct settings:
Common HTTP Features:
Static Content
Default Document
HTTP Redirection
Directory Browsing
Application Development:
ASP.Net
ISAPI Extension
ISAPI Filters
Security:
Windows Authentication
Tools:
IIS Metabase Management
IIS 6 WMI Management
Then make sure you set tcp and named pipes in the sql server surface area configuration tool for the remote connections.
Then install service 2 for sql server and the service pack for the service pack if it isn't up to version 9.0.3054
Then run the sharepoint reporting services msi file that integrates them noting this doesn't run on a windows 208 server unless you install a reg hack to run as admin or turn off the uac.
Then you need to go into the reporting services configuration tool to configure and that is where many get mixed up.
Reporting Services needs to use the same pool as sharepoint to integrate.
Everything finally fell into place except the reporting services configuration settings didn't show in the sharepoint admin application page.
Had to go to the _layouts pages instead.
When deploying your reports, the pc with report designer should also be service packed and then you get an extra option regarding sharepoint in your deployment options wording for your target folders etc.
http://servername:portno/_layouts/ReportServer/ReportServerSiteSettings.aspx
http://servername:portno/_layouts/ReportServer/ManageTrustedAccounts.aspx
http://servername:portno/_layouts/ReportServer/ReportServerSiteSettings.aspx?Settings=RS
Regards,
Tom Bizannes
Sydney, Australia
For Consulting click here:
Wednesday, February 06, 2008
Windows Server 2008 was released to manufacturing today along with Windows Vista SP1.
Now all the fun updating etc….
Think I’ll wait and see how many people have issues!
Windows Server 2008 was released to manufacturing today along with Windows Vista SP1. Good stuff.
Don’t you love how they’ll give everyone until April before windows update will clobber their pcs anyway?
Think I’ll wait and see how many people have issues!
Windows Server 2008 was released to manufacturing today along with Windows Vista SP1. Good stuff.
Don’t you love how they’ll give everyone until April before windows update will clobber their pcs anyway?
Installing SQL 2005 on Vista or Windows 2008:
There have been some installations with sql 2005 without sql 2005 reporting services due to not adding some components in windows 2008 or vista.
Installing SQL 2005 on Vista or Windows 2008:
And any installs on Windows 2008 Server or Vista PCs won’t install reporting services 2005 unless you make sure you have added all the required internet components, not just IIS7.
You need IIS 6 compatibility, plus a lot of other components so read this article:
http://support.microsoft.com/kb/934164
You need to run the install as admin.
Install SQL server 2005 then the Sql Server 2005 sp2 and then the vista provisioning tool and Visual Studio sp1.
** All fun but easier than the alternative to uninstalling and then do the steps above and then re-attaching all databases….just because an install missed one step.
Thursday, October 11, 2007
Save the pies for dessert!
Microsoft SQL Server User Group 5th October 2007
This was very interesting from a Reporting / Dashboard point of view!
Time was also convenient as Microsoft has just released Performance Point Server, their Hyperion/Cognos/Business Objects replacement product!
Stephen Few has two books out – one called “Show me the numbers!” and another called “Information Dashboard Design”.
I am definitely leaning towards getting his latest book …
He was a manager of a Business Intelligence team but wasn’t happy with a lot of standard charts and tables produced as they only served to confuse top executives!
So he quit to work on finding better ways to communicate with graphs and tables!
Most modern charts might look fancy but they don’t often help decision makers or anyone looking at them to really glean information.
He walked us through many examples of ones entered by software vendors in competitions plus from the software user documentation and in most cases showed how they weren’t effective in telling the story.
So it appears many people mislead without knowing as opposed to the old days when people lied with statistics.
He mentioned a book called how to lie with statistics and how this was a best seller!
Some vendors have some amazingly confusing charting features which are up there in the stratosphere for confusing people!
There was a charting guy called Edward Tuftie back in the 80’s and most of his ideas still hold in today’s reporting but very few use them.
This was more about what not to use versus what to use..
e.g. 3D charts look good but the human eye cannot work out the shades and angles.
Often tables can convey information better than charts.
Vertically orientated labels are very difficult to read.
Tables are good for individual values or mixing different types of data e.g. % and $...
Fancy terms like spark lines and blink graphs were thrown around…
Small multiples was a concept by Edward Tuftie in 1983…
This involves breaking up one chart into many charts.
E,g, Sales Per Month for different products.
Breaking this up into a chart for each product all on one page.
E.g. if you have 8 products then break this up into 8 mini charts!
That way one can glance at the figures to better see which product / products need attention etc.
But be careful as most people can only remember 4 chunks of information at a time!
10% of men cannot distinguish between green and red!
So often using shades of the one colour is better than having a traffic light approach!
He does this one day training and gets people walking out and making reports so much more informative!
At the end of the day a Dashboard should highlight what’s important.
Although in a discussion at work it appears that company annual reports use alot of pie charts as they don't want to easily show any anomalies etc to their readers!
So you are not always required to make numbers pop out of the page for decision makers ....
Some tools to investigate include:
Juice Analytics – used to have a free excel addin.
MicroCharts for Excel – bought by XLCubed? And there is a product called Chart Tamer?
http://www.xlcubed.com/en/Products_XLCUbed_MicroCharts.html
Tablo and Spot fire were also mentioned
When I did some checking on Juice Analytics foud this article which shows one of the silly things people do with charts that can easily mislead.
http://www.juiceanalytics.com/writing/2007/06/excel-2007-and-lie-factor/
Found MicroCharts at BonaVista?
http://www.bonavistasystems.com/
Tom Bizannes is a SQL Server Professional in Sydney Australia.
http://www.smartbiz.com.au
Wednesday, September 19, 2007
Performance Point demo at .Net User Group Wednesday 19th September 2007
The turnout was smaller than usual!
Maybe the topic was more suited to the SQL Server user group!
First the news then the demo on Performance Point which will mean more business for companies who write cubes!
Office 2003 service pack 3 is out!
Office DevCon is coming at Microsoft over the weekend of 3 and 4th of November.
Bit like a code camp
Adam couldn’t stop talking about facebook and how much time he spends on it.
They even track how long staff use facebook as he is worried they might get as addicted as he is.
Simple things like seeing who has the fastest broadband connectivity or who has travelled the most etc…..
Cool sites were mentioned like trailfire.com where you can make a trail of your searching along with comments.
Useful? An example was looking up info on css and seeing the trail to sites with good info.
One could also use this to make a trail of places you are going to see…Good for travellers?
There’s a free High Performance Computing event this Friday at the MLC Centre.
This is by Frank Chism, world expert in high performance computing, discuss the future of cluster server technology
Frank admits to "over 40 years in HPC" and is "not looking to leave any time soon because I couldn't afford the cool toys I get to play with if I have to buy them myself."
Andrew Coates from Microsoft also talked about the OpenXML standard going to ISO…
There are some links regarding this and what was funny was how they even held events in New Zealand to explain this in more detail but the Kiwis rejected the proposal and we discussed is that because they are so anti-american?
The OpenXML standard apparently is more flexible than ODF and standardises even the older Microsoft office formats.
For more information goto:
openxmlcommunity.org/
openxmldeveloper.org/
Those who follow second life will like the inline protest of ibm staff against the 50 virtual offices that ibm runs as the profit has gone up but their bonuses have gone down!
workers-shape-up-for-big-blue-with-ibm
techcrunch.com/ - IT news – has rss feeds….
iScrybe for online calenders was mentioned as worth taking a look
They explained that SSW workers only do things if they get an email…talk about an inbox nightmare!
They didn’t want to use outlook as it was a problem with people coming and going…..
So they asked a business person to come up with a way to email monthly/quarterly tasks to staff and Google Calendar got a good wrap as it allows sending to many and can be shared easily.
You can even write code to talk with Google Calendar.
What I found perplexing was they mentioned SharePoint but then dished that as not be easy to set up re-occurring tasks!
From my view point their requirement is a little crude as one likes to know if a task has been completed and this didn’t seem to be their business requirement!
Performance Point:
There are three different parts to this.
M A P
M – Monitor / KPIs – based on Business ScoreCard Manager…
A – Analyse – They bought pro-clarity and what a Kool tool! ….This alone is worth it!
P – Planning (Planning/ Forecasting/Budgeting etc) from BizSharp – have yet to see anything about this but the business users like this part!
The main competitors are: Business Objects / Cognos and Hyperion.
At about 20K USD and $200USD per user, one of the guys from CBA where they use this said that was a good price.
Business Objects drill through isn’t as good…
Cognos is used by many in a similar way that reporting services is used….
There are guys at Microsoft who only deal in one of these three areas..and Adam only walked us through a canned demo of the first two.
So this is the new Hyperion Killer – Hyperion is a great tool, Ajaz enabled and using Bindows.net which is a very cool bit of Ajax technology that has been around for a few years.
Performance Point should lift the demand for SQL Server cubes being built although it can query normal odbc sources….
It works with SharePoint and was annoyed at Adam’s comment that you need Moss when it states either wss3 or moss!
It even states Office 2003 in the requirements…
This will be released soon so we should see the final specifications then.
The target market is decision makers and Ceos and Operational Managers will go gaga over this!
Regards,
Tom Bizannes
Sydney, Australia
Subscribe to:
Posts (Atom)